


 Bitcoin Retreats as Geopolitical Tensions Flare: BTC/USD Dips Following Iran’s Rejection of Ceasefire
  Bitcoin Retreats Toward Critical Support as Geopolitical Winds Shift
  Ethereum’s $2,200 Ceiling: Can Diplomatic Breakthroughs Dissolve the Bearish Resistance?
  BTCUSD Coils in Tight Range: Will Geopolitical Stability Trigger a Breakout Toward $80,000?
  Ethereum Steady Above USD 2,000: ETH Tracks Bitcoin’s Lead as Bulls Eye a USD 2,770 Breakout


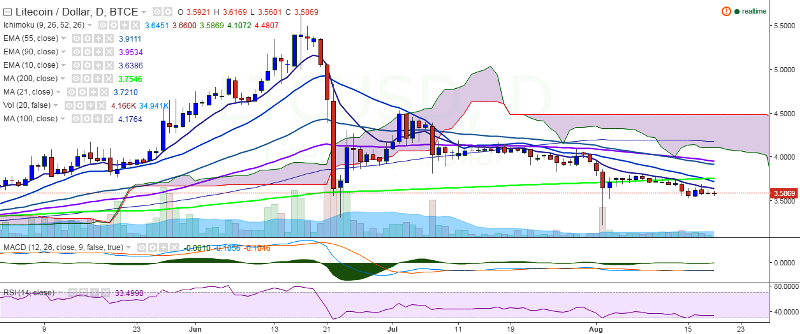
LTC/USD continues to trade in a narrow range between 3.56 and 3.61 levels on Friday, holding its ground above 3.50 levels. It is currently trading at 3.57 levels at the time of writing (BTC-e).
Ichimoku analysis (Daily chart):
Tenkan Sen: 3.65
Kijun Sen: 3.66
Trend reversal: 3.96 (90 EMA)
On the topside, the pair faces major resistance at 3.74 levels (21-day MA) and a break above would take the pair to 3.96 (90 EMA)/4.17 (100-day MA). On the downside, the pair seems to be getting strong support at 3.50 levels (psychological level) and break below would drag the pair to 3.22 (August 2 low)/3.00.

- News

- Economy

- Central Banks
- Investing
- Research
- Roundups
- Digital Currency
- Insights
- Technical Analysis
- Technology
- Business
- Law
- Health
- Nature
- Fintech
- Science
- Topic
- Opinions
- ©Econometrics LLC . All Rights Reserved.
LTC/USD continues choppy trade, scope for further downside below 3.50
Friday, August 19, 2016 10:59 AM UTC
Editor's Picks


- Market Data
Most Popular


